Features of Open OnDemand
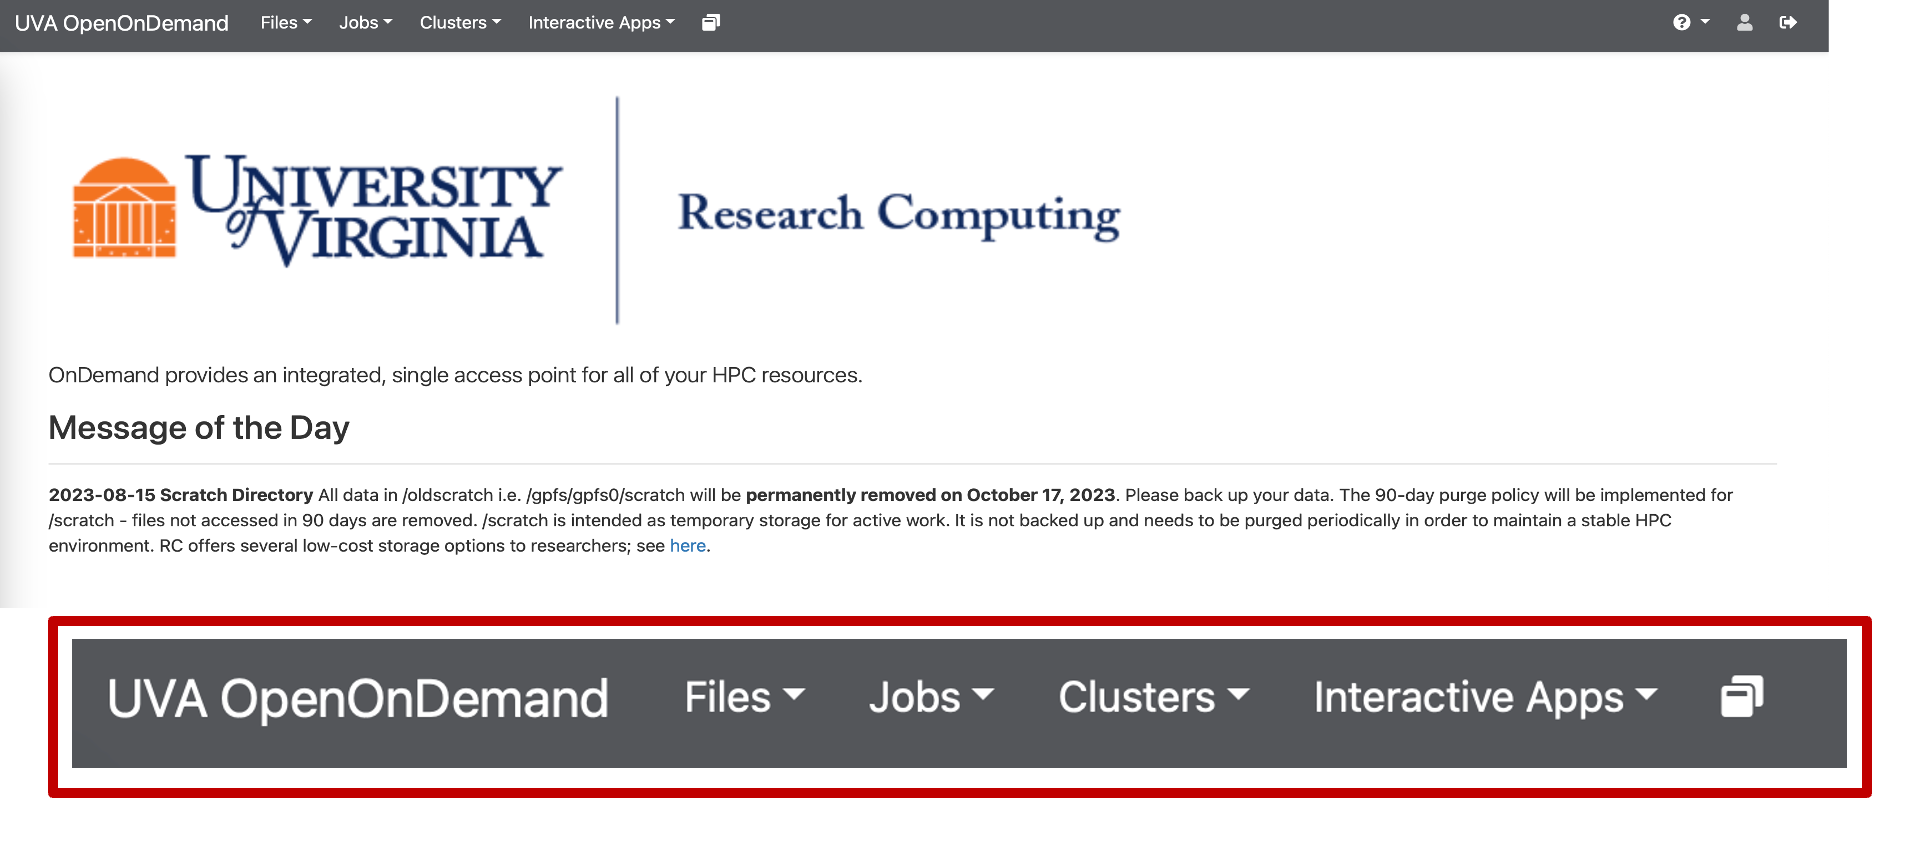
Open OnDemand has many features accessible directly from the menu bar.
Features of Open OnDemand Video Transcript
Narrator: Hello and welcome back to the University of Virginia’s High Performance Computing Tutorial series. This module will be an overview of all the features available in Open OnDemand.
All of the different things you can do are in the top bar: Files, Jobs, Clusters, Interactive Apps, and Utilities, all the way on the right. In addition, we will cover some commands that can be run in the terminal to work with the HPC system.
The first section is the Files tab. This is an easy way to work with files on the cluster, which is covered in other content.
Next up is the Jobs dropdown. I’ll start with the Job Composer. This is how users can create new batch jobs and submit them to the cluster’s compute nodes. This video is not an overview of batch jobs, however; that is covered in other content. I will just demonstrate how to use the Job Composer to run a batch job.
You can select from a very simple default template or if you go to the Templates tab, you can see that there is a bunch of different templates that we have created. The demo_hello_world is a very simple template that you can start with.
To create the file, go back to the Jobs tab, click New Job, and select From Default Template. From here, all of the details of the job will be listed on the right. You can see information like the name of the job and where the script is located in the file system. The script name in this case is demo_hello_world.slurm.
If you scroll down, you can open the file itself with an editor using the Open Editor button. When you’re using the Job Composer, you will need to change your allocation. You’ll use whatever allocation you’re a part of. In my case, that’s hpc_training, but you should use the allocation your PI has given you.
From here, you can edit this file to include more code or references to your code. This example command will print out the string “Hello” and then my username, and then it’ll output the host name, which is the actual name of the node.
After making edits to this file, click Save and then close the tab. Once you have a functioning job script and you’re ready to submit it, scroll up and there will be a Submit button. Highlight your job, select Submit, and that will submit your job to Slurm, our resource manager.
It will be queued up, and as you can see, it’s running now and it completed very quickly. If you want to view the output, you can scroll down to Folder Contents. There is an output file here, and you can open that up to see the print statement that you had put there. Close this tab to go back to the Open OnDemand homepage.
To view all the different jobs, whether yours or others on the cluster, use the Active Jobs option. At first, it will show you every single job that is either queued up, running, or recently completed on the cluster. That is a lot of information, so you can filter using your computing ID on the right with the Filter option, or there is a drop-down where you can switch from all jobs to just your jobs.
As you can see, I’ve got the job that I recently submitted. If you want more details about this job, you can click the drop-down on the left. From here, you can get a lot of information that was in the resource request for your job, such as the account you ran on, the partition you were submitting to, the state of it, as in whether or not it’s completed, and how many nodes or CPUs you were requesting.
There is also information relevant to the job as it was running, such as the node list, as in what node the job ran on, the amount of time you actually used versus the time you requested, the start time and end time, and the location of where the job was run and where the output was sent to.
If you have a job that’s queued up and still waiting, and you need to delete it from the queue, there is the Actions bar all the way on the right. From here, there will be a little trash icon that you can use to delete your job from the queue.
This is a low-level guide on how to use this feature. Other content is available to learn more about Slurm, our resource manager, and running jobs.
The Clusters dropdown here has two options, which are HPC Shell Access and System Status. HPC Shell Access opens a command line, and from here you can do command line work on the cluster, similar to using SSH, but entirely within the web browser. System Status will show current usage statistics of the cluster.
Next, there are the Interactive Apps. These are a list of the different GUI applications that you can use on the cluster. These are all run through our compute nodes, not just our login nodes.
For example, if you have Python code that you want to run interactively through the JupyterLab IDE as a Jupyter notebook, you can launch JupyterLab and run it from a compute node instead of just running it from a login node. There are also a bunch of other applications like Matlab and Code Server.
Additionally, there is a desktop app that you can use to get a FastX-like desktop view of the cluster, but on a compute node rather than a login node. To the right of interactive apps is an icon. This is where you can see all of your current ongoing interactive app sessions and perform actions on them.
Then there is the Utilities tab on the right. There are a couple of different utilities available for you to use. The first one is Disk Usage. It will output a bunch of information about your storage utilization. If you’re a member of any Research Standard or Research Project storage shares, you can see all of that utilization as well.
Another option in the Utilities tab is Queue Status, which gives you a snapshot of the different queues at a given moment. For instance, I can see that the GPU queue is very busy with about 700 jobs pending right now, whereas standard isn’t super busy with only 30 jobs pending and about 250 running, leaving a lot of free cores.
Another option in Utilities is Check Scratch for Purge. The scratch file system has a 90-day purge policy, meaning data is automatically deleted if you haven’t used it in a while. This feature allows you to check your scratch files to see if anything is going to be deleted soon.
If I run this, I can see a couple of purge dates, as well as the number of files. I’ve got some files here that are going to be deleted soon. You can then save this list to your home folder to take action on it. You can save that list to your scratch folder to keep it in scratch or download those names locally.
It’s important to note that these buttons only save a list of file names, not the files themselves. You need to view the list and take action on it.
The last utility is the Slurm Script Generator. This is something you can use to create new batch scripts that you can submit later. This page gives you a form that you can fill out on the left where you can give it a job name and your allocation.
You can select the partition, adjust the number of resources that you want, such as the number of cores and the time limit for your job, and you can request it to email you whenever your job begins, ends, or fails. You can do a couple of other things using the additional Slurm options checkbox, where you can write any other custom Slurm command.
Once you’ve adjusted all of these parameters, you can download the script, which will send it to your computer’s local downloads folder. You can then upload it later, add the code you wish to run, and submit it.
Finally, here’s a small list of HPC-specific commands that you can use from the command line to get more information about jobs, allocations, and so on. The first command is allocations. This will display information on the allocations you are a part of and how many service units you have.
Running this command, I can see that I’m a part of these allocations and the balance of SUs that I have. You can learn more about a specific allocation by using the allocations -a command. Running this will provide more details about when the allocation was renewed, how many SUs you have, the percentage used, whether or not it’s active, and all the members of the allocation.
The next command is hdquota. This command provides the same output as the Disk Usage feature on Open OnDemand. It shows you how much of your storage you’re using. You can see your home and scratch directories, how much you’ve used, what’s available, and the percentage used.
If you have any Research Project or Research Standard storage, that’s listed there as well. This gives you a total utilization overview. If you want more detailed information on what folders and files are taking up space, you may want to use the standard Linux du command to investigate.
However, the default output for this command is hard to decipher, so it’s recommended to run something like du . -h –max-depth=1 The period represents the folder that you’re currently in, so in this case my home folder. The -h option ensures that the sizes are displayed in a human readable format like kilobytes and gigabytes. The –max-depth=1 option limits the command to only run for the folders in the base of wherever the command is being run, and not the folders and files inside of that.
Those are the two main accounting commands. The rest of the commands we’ll cover are for getting information on the cluster itself and the different partitions. The first such command is qlist. This will output the current usage of all the different partitions.
You can see the total jobs running, how many jobs are pending, total free cores, and the time limit for each of the partitions. You can also use qlist with the -p option to specify a particular partition. For example, If I specify the GPU partition, it will print out more detailed information about just the GPU partition.
You can see states on the left indicating how much of a given node is being used. Mix means it’s not completely in use, allocated means it’s totally used up, and draining means it’s no longer accepting jobs.
Then there’s the qlimits command. This will output information on the limitations for each of the partitions, including hardware limitations. For example, in the standard partition, you can see the maximum memory per node that’s allowed. You can also see the maximum number of cores you’re allowed to use at a time, the number of GPUs for the GPU partition, the maximum number of jobs you can submit, as well as the maximum memory per core, default memory per core, and maximum nodes per job. It provides a comprehensive overview of various limitations.
Finally, if you need help with UVA’s HPC system, there are multiple ways to get assistance. You can visit our Zoom-based office hours sessions on Tuesdays from 3-5pm and Thursdays from 10am to noon. If you can’t make it to these office hours or have a more specific request, you can submit a support ticket and we’ll get back to you.
Links to both are on the RC Learning website. The main Research Computing website is also a valuable resource. We add a lot of documentation here and keep it updated. If you have a basic question or think it might be covered already, we have an FAQ section. We also have a list of how to’s on various topics. If you can’t find what you’re looking for, we have a search feature where you can search our site for different information.
This concludes the features of Open OnDemand tutorial at the University of Virginia. Thank you.