Statistical Methods with MATLAB
Overview
MATLAB is an integrated technical computing environment from the MathWorks that combines array-based numeric computation, advanced graphics and visualization, and a high-level programming language. Separately licensed toolboxes provide additional domain-specific functionality.
Matlab Academy: Statistical Methods with Matlab
Documentation: Statistics and Machine Learning Toolbox (help page)
Documentation: Statistics and Machine Learning Toolbox (product page)
Course Overview
Video: Statistical Methods with Matlab
Exploring Data
Visualizing Data Sets


Documentation: histogram boxplot scatter
### Measures of Centrality and Spread


Documentation: mean median mode trimmean


Documentation: std iqr range var
Distributions


Documentation: normpdf unifpdf randn rand
Summary


Fitting a Curve to Data
Linear Regression


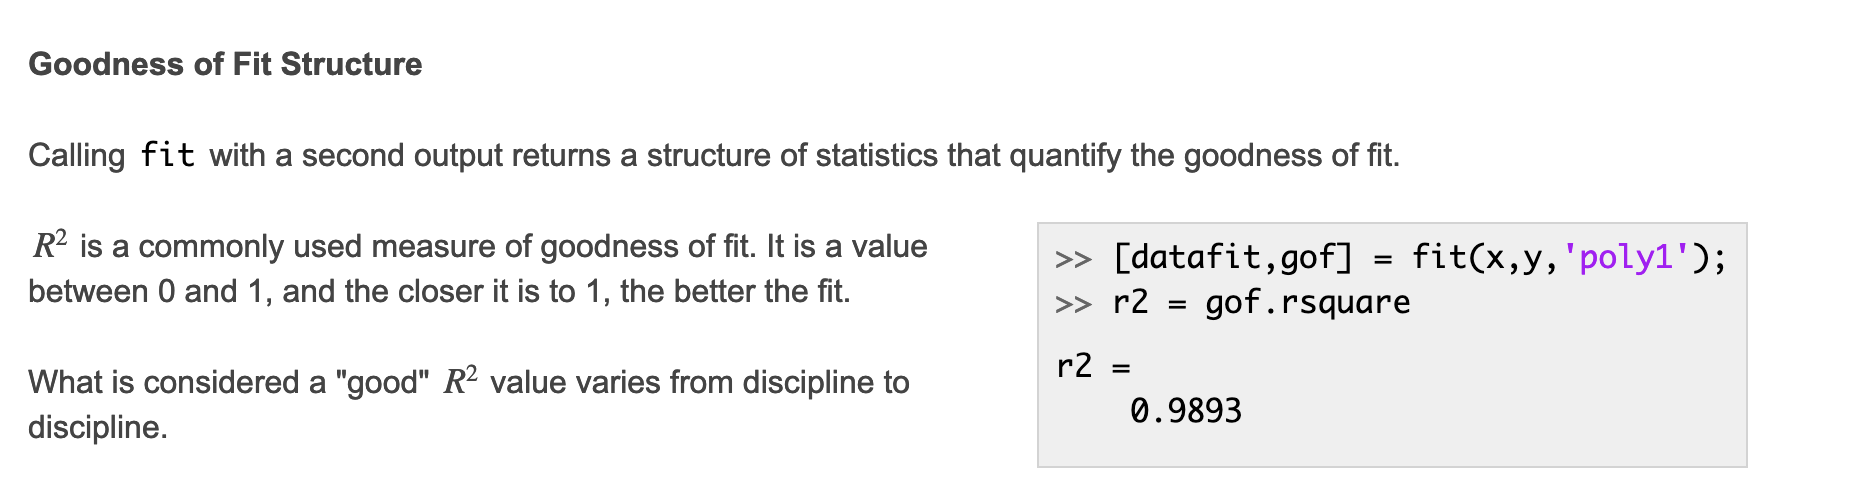
Evaluating Goodness of Fit


Nonlinear Regression


Summary


Interpolating Data
Linear Interpolation


Nonlinear Interpolation


Summary


Additional Resources

**MATLAB Central** ** MathWorks Support **
Exercises
Visualizing Data sets
Exercise: Visualize Height and Weight Data
Measure of Centrality and Spread
Exercise: Find the Mean and Median
Exercise: Find the Standard Deviation and IQR
Distributions
Exercise: Fit and Plot a Normal Distribution
Exercise: Generating Random Numbers
Review: Exploring Data
Linear Regression
Exercise: Fit a Polynomial to Data
Evaluating the Goodness of Fit
Exercise: Evaluate and Improve the Fit
### Nonlinear Regression
Exercise: Fit a Nonlinear Model
Review: Fitting a Curve to Data
Exercise: Temperature Fluctuations
Linear Interpolation
Exercise: Fill in Missing Data
Nonlinear Interpolation
Exercise: Resample Data with Different Interpolation Methods