pLDDT Plot
ranked_0_pLDDT.png
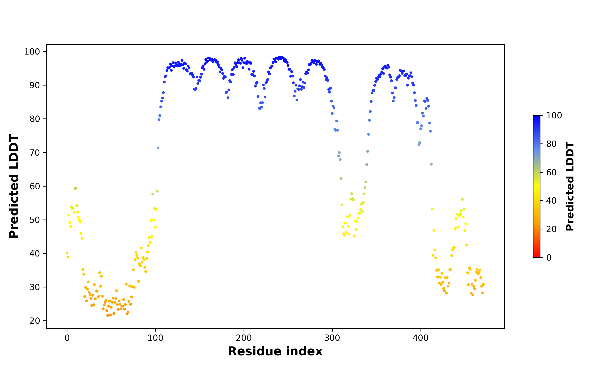
This output plot shows the per-residue confidence scores (pLDDT) for the top-ranked AlphaFold model (ranked_0.pdb).
For example, CB1 is a 7-transmembrane (7TM) domain protein with less-structured tails on both termini which is reflected in the plot.
Key Details
CB1 is a G protein-coupled receptor (GPCR) with a 7-transmembrane domain structure. The N-terminus (5′) is extracellular and the C-terminus (3′) is intracellular. AlphaFold predicts loops between each transmembrane alpha-helix — one of which is noticeably longer and more disordered, as reflected by lower pLDDT values.
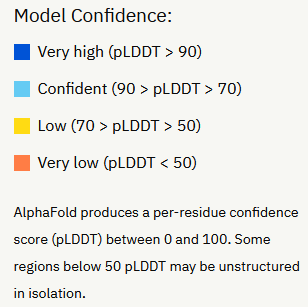
Most of the termini are unstructured, which shows up as lower-confidence (yellow/orange) regions in the plot.
Source: Arnold, M. J. (2021) AlphaPickle doi.org/10.5281/zenodo.5708709