Modify Visualization in VMD
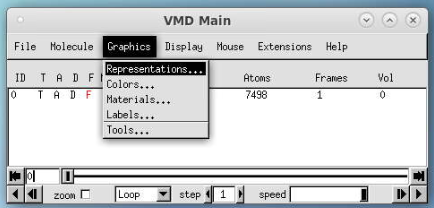
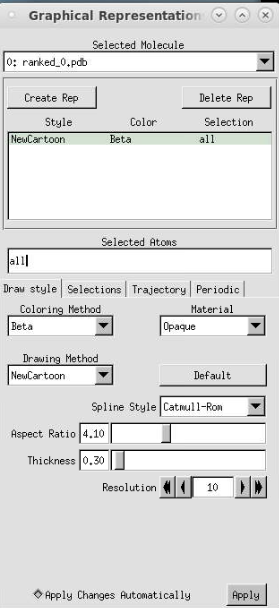
Once your PDB file is loaded in VMD, you can change the visual style using the Graphical Representations menu.

Representation settings
Drawing Method: Set to NewCartoon to show ribbon structure.
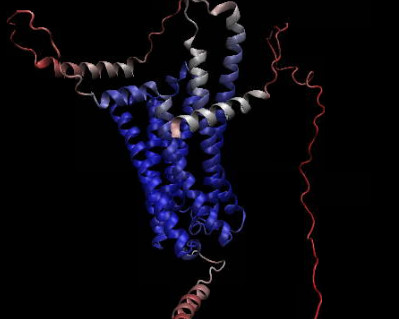
Coloring Method: Set to Beta to visualize pLDDT confidence values (stored in the beta column).

Result
