Preprocessing/QC
This workshop will cover selection and filtration of cells based on QC metrics, data normalization and scaling, and detection of highly variable features.
A few QC metrics commonly used by the community include:
- The number of unique genes detected in each cell. Low-quality cells or empty droplets will often have very few genes, while cell doublets or multiplets may exhibit an aberrantly high gene count.
- The total number of molecules detected within a cell, which correlates strongly with the number of unique genes.
- The percentage of reads that map to the mitochondrial genome, where low-quality/dying cells often exhibit extensive mitochondrial contamination.
Interactive Workshop: Preprocessing/QC
Adding slots to the PBMC data object
The [[]] operator can add columns to object metadata. This is a great pace to stash QC stats.
# Adding percent mitochondrial column to metadata data frame
pbmc[["percent.mt"]] <- PercentFeatureSet(pbmc, pattern = "^MT-")
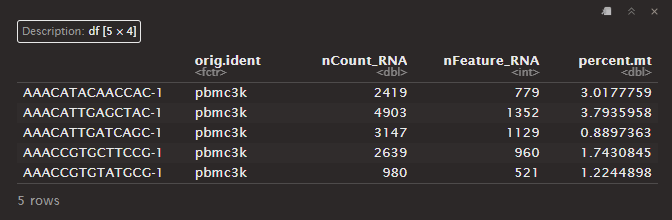
You can display the object metadata data frame to see QC metrics:
# Show QC metrics for the first 5 cells
head(pbmc@meta.data, 5)
Output:
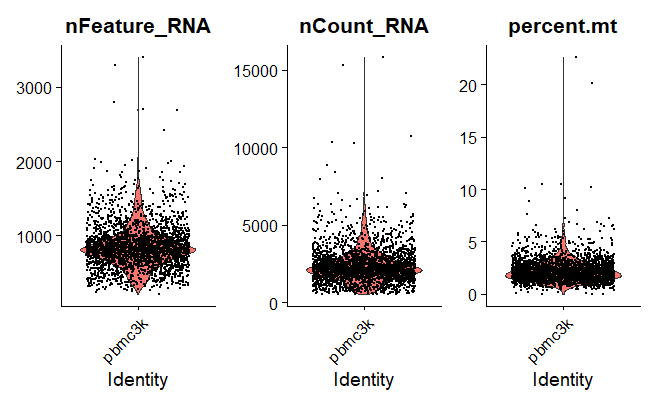
Violin Plot
A violin plot is a hybrid of a box plot and a kernel density plot, which shows peaks in the data. It is used to visualize the distribution of numerical data. Unlike a box plot that can only show summary statistics, violin plots depict summary statistics and the density of each variable.
VlnPlot(pbmc, features = c("nFeature_RNA", "nCount_RNA", "percent.mt"), ncol = 3)
Output:
FeatureScatter
FeatureScatter is typically used to visualize feature-feature relationships, but can be used for anything calculated by the object, i.e. columns in object metadata, PC scores, etc.
plot1 <- FeatureScatter(pbmc, feature1 = "nCount_RNA", feature2 = "percent.mt")
plot2 <- FeatureScatter(pbmc, feature1 = "nCount_RNA", feature2 = "nFeature_RNA")
plot1 + plot2
Output:
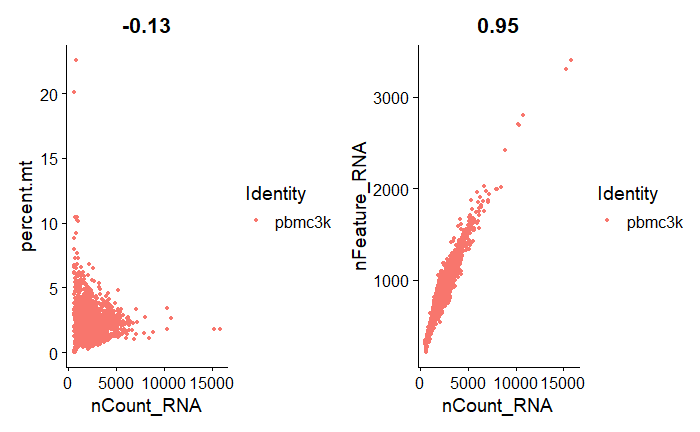
nCount_RNA & nFeature_RNA are highly correlated (0.95) because cells with more reads usually have more detected genes. percent.mt (percent mitochondrial) and nCount_RNA are not correlated at all (-0.13), meaning mitochondrial contamination is independent of sequencing depth, which helps QC by allowing separate cutoffs for these metrics.