Identify Highly Variable Features
Next, identify the subset of features that exhibit high cell-to-cell variation. In other words, they are highly expressed in some cells, and lowly expressed in others.
Focusing on these genes in downstream analysis helps to highlight biological signal in single-cell datasets.
This step directly models the mean-variance relationship inherent in single-cell data, where genes with higher mean expression tend to have higher variance across cells. The FindVariableFeatures() function returns 2,000 features per dataset by default.
Use these variable features in downstream analysis, such as PCA.
pbmc <- FindVariableFeatures(pbmc, selection.method = "vst", nfeatures = 2000)

# Identify the 10 most highly variable genes
top10 <- head(variableFeatures(pbmc), 10)

# Plot variable features with labels
plot1 <- variableFeaturePlot(pbmc)
plot1 <- LabelPoints(plot = plot1, points = top10, repel = TRUE)
plot1
Output:
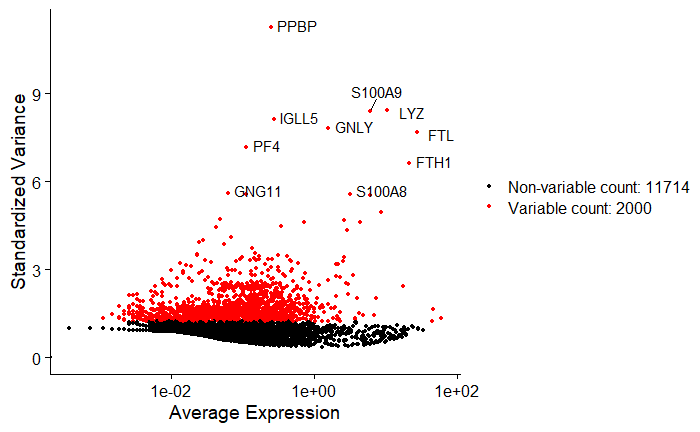
We measure average expression against standardized variance to identify genes that are more variable than expected given their mean expression. Standardizing the variance removes the natural relationship where genes with higher mean expression also tend to have higher variance.
In the plot, the PPBP (Pro-Platelet Basic Protein) gene is highly variable because it is expressed only in platelets.