Non-Linear Dimensionality Reduction (UMAP)
The goal of non-linear dimensionality reduction is to learn the underlying manifold of the data in order to place similar cells together in low-dimensional space.
Seurat supports two methods: t-SNE and UMAP. This tutorial will only cover UMAP.
Read about the difference: https://blog.bioturing.com/2022/01/14/umap-vs-t-sne-single-cell-rna-seq-data-visualization/
Cells within the graph-based clusters determined previously should co-localize on these dimension reduction plots.
The input is the same PCs as used in the clustering analysis.
# If you haven't installed UMAP, you can do so via reticulate::py_install(packages = 'umap-learn')
pbmc <- RunUMAP(pbmc, dims = 1:10)

# Note that you can set `label = TRUE` or use the `LabelClusters()` function to help label individual clusters.
DimPlot(pbmc, reduction = "umap")

# You can save the object at this point so that it can easily be loaded back in without having to rerun the computationally intensive steps performed above, or easily shared with collaborators.
saveRDS(pbmc, file = "./output/pbmc_tutorial.rds")
Output:
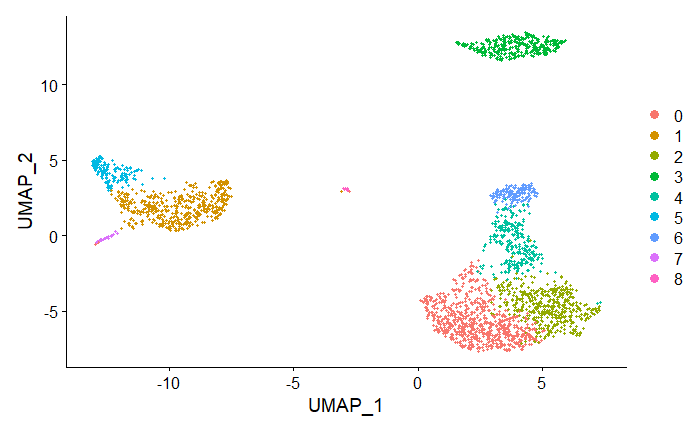
The plot is colored by clusters previously identified in KNN clustering. Note the colocalization of cells in each cluster.