Differential Expression
Now that we have clustered the data, we want to identify biomarkers for each cluster.
# Find all markers of cluster 2
cluster2.markers <- FindMarkers(pbmc, ident.1 = 2, min.pct = 0.25)
head(cluser2.markers, n = 5)

# Find all markers distinguishing cluster 5 from cluster 0 and 3
cluser5.markers <- FindMarkers(pbmc, ident.1 = 5, ident.2 = c(0,3), min.pct = 0.25)
head(cluster5.markers, n=5)

#Find markers for every cluster compared to all remaining cells, report only the positive ones
pbmc.markers <- FindAllMarkers(pbmc, only.pos = TRUE, min.pct = 0.25, logfc.threshold = 0.25)

# Show top 2 positive markers for each cluster
pbmc.markers %>%
    group_by(cluster) %>%
    slice_max(n = 2, order_by = avg_log2FC)
Output:
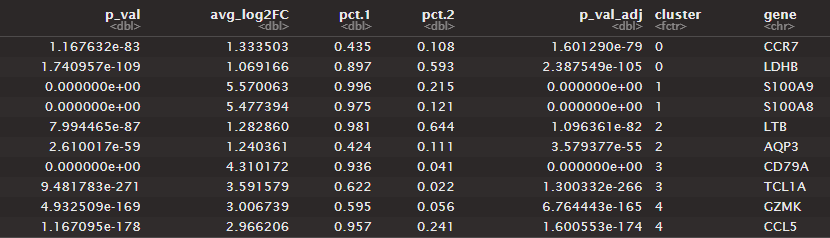
The table shows output from the last 3 lines of code. It finds markers for every cluster compared to all remaining cells, reports only the positive ones, and shows the top 2 for each cluster.