Modifying Plots
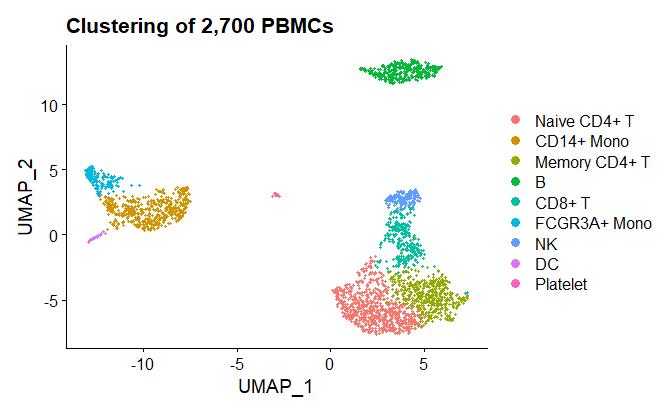
Using the canonical biomarkers, we can assign meaningful names to each cluster and update the plots, allowing for easier interpretation.
All Seurat plots are ggplot2-compatible, so you can add titles (as shown here), change themes, etc.
new.cluster.ids <- c("Naive CD4+ T", "CD14+ Mono", "Memory CD4+ T", "B", "CD8+ T", "FCGR3A+ Mono", "NK", "DC", "Platelet")
names(new.cluster.ids) <- levels(pbmc)
pbmc <- RenameIdents(pbmc, new.cluster.ids)
DimPlot(pbmc, reduction = "umap", label = TRUE, pt.size = 0.5) + NoLegend()

baseplot <- DimPlot(pbmc, reduction = "umap")
baseplot + labs(title = "Clustering of 2,700 PBMCs")
Output: